MyEnviro
Two weeks to untangle a trust problem between farmers and their regional council.
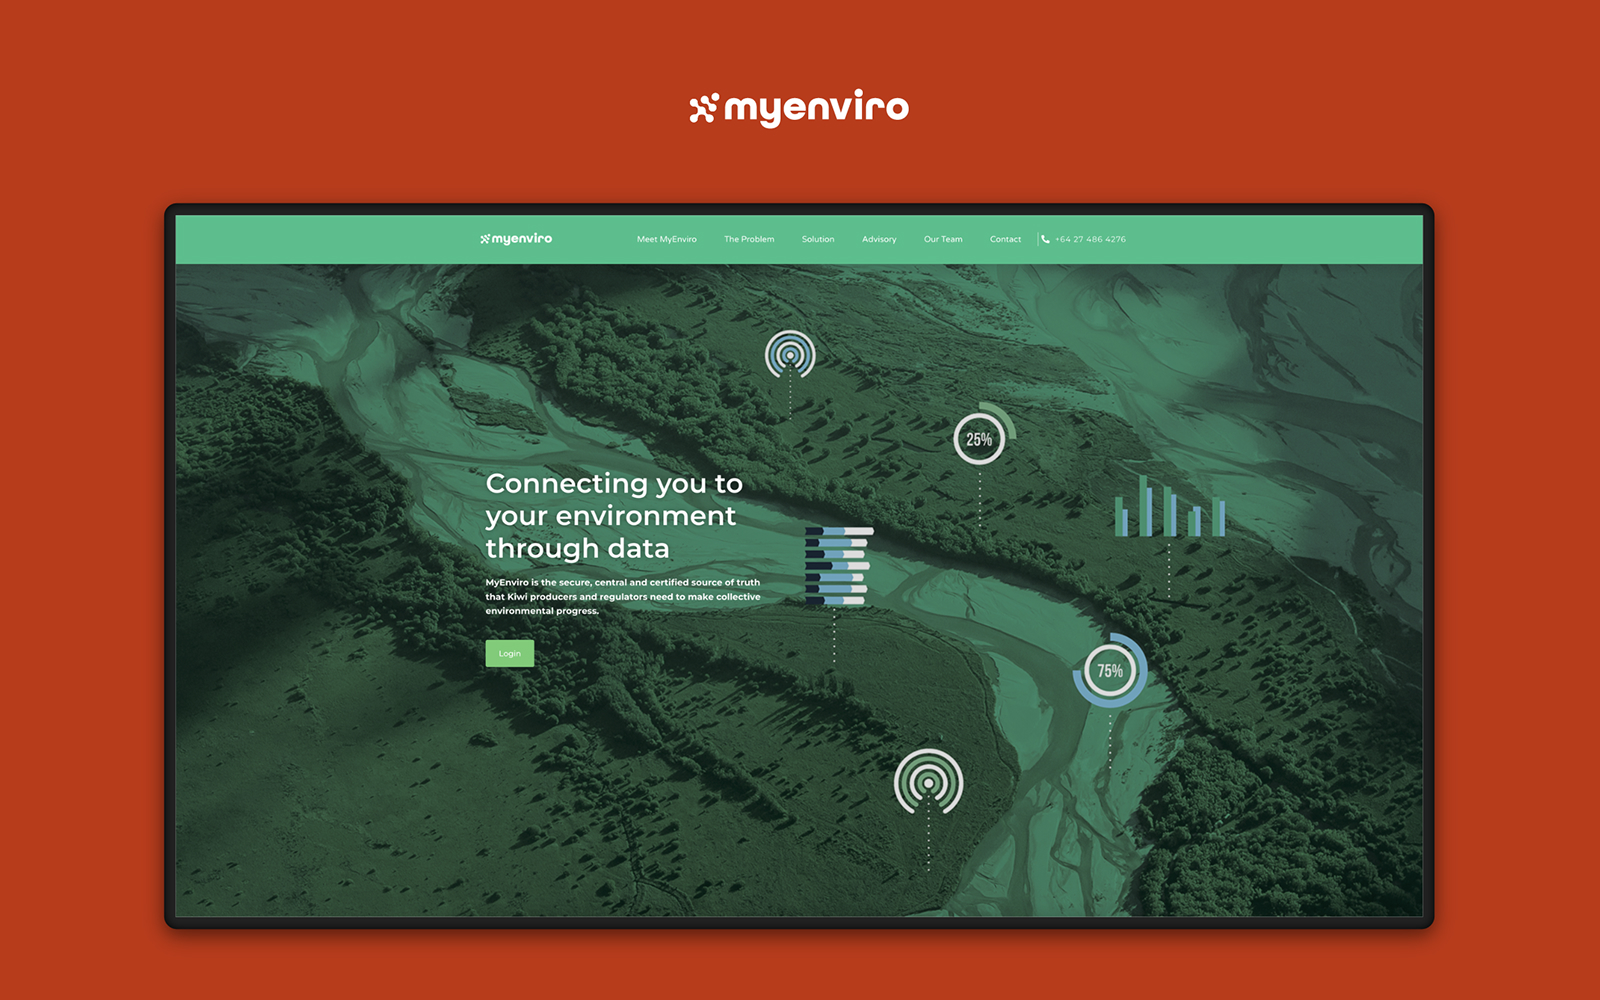
Rapid discovery
A two-week window to go from nothing to a fully designed and prototyped feature.
The Hawke's Bay Regional Council needed a specialised tool inside the MyEnviro platform — a feature called Right Tree Right Place — that would help both council staff and farmers manage sustainable land use through shared, precise environmental data. I had two weeks to design its end-to-end user experience.
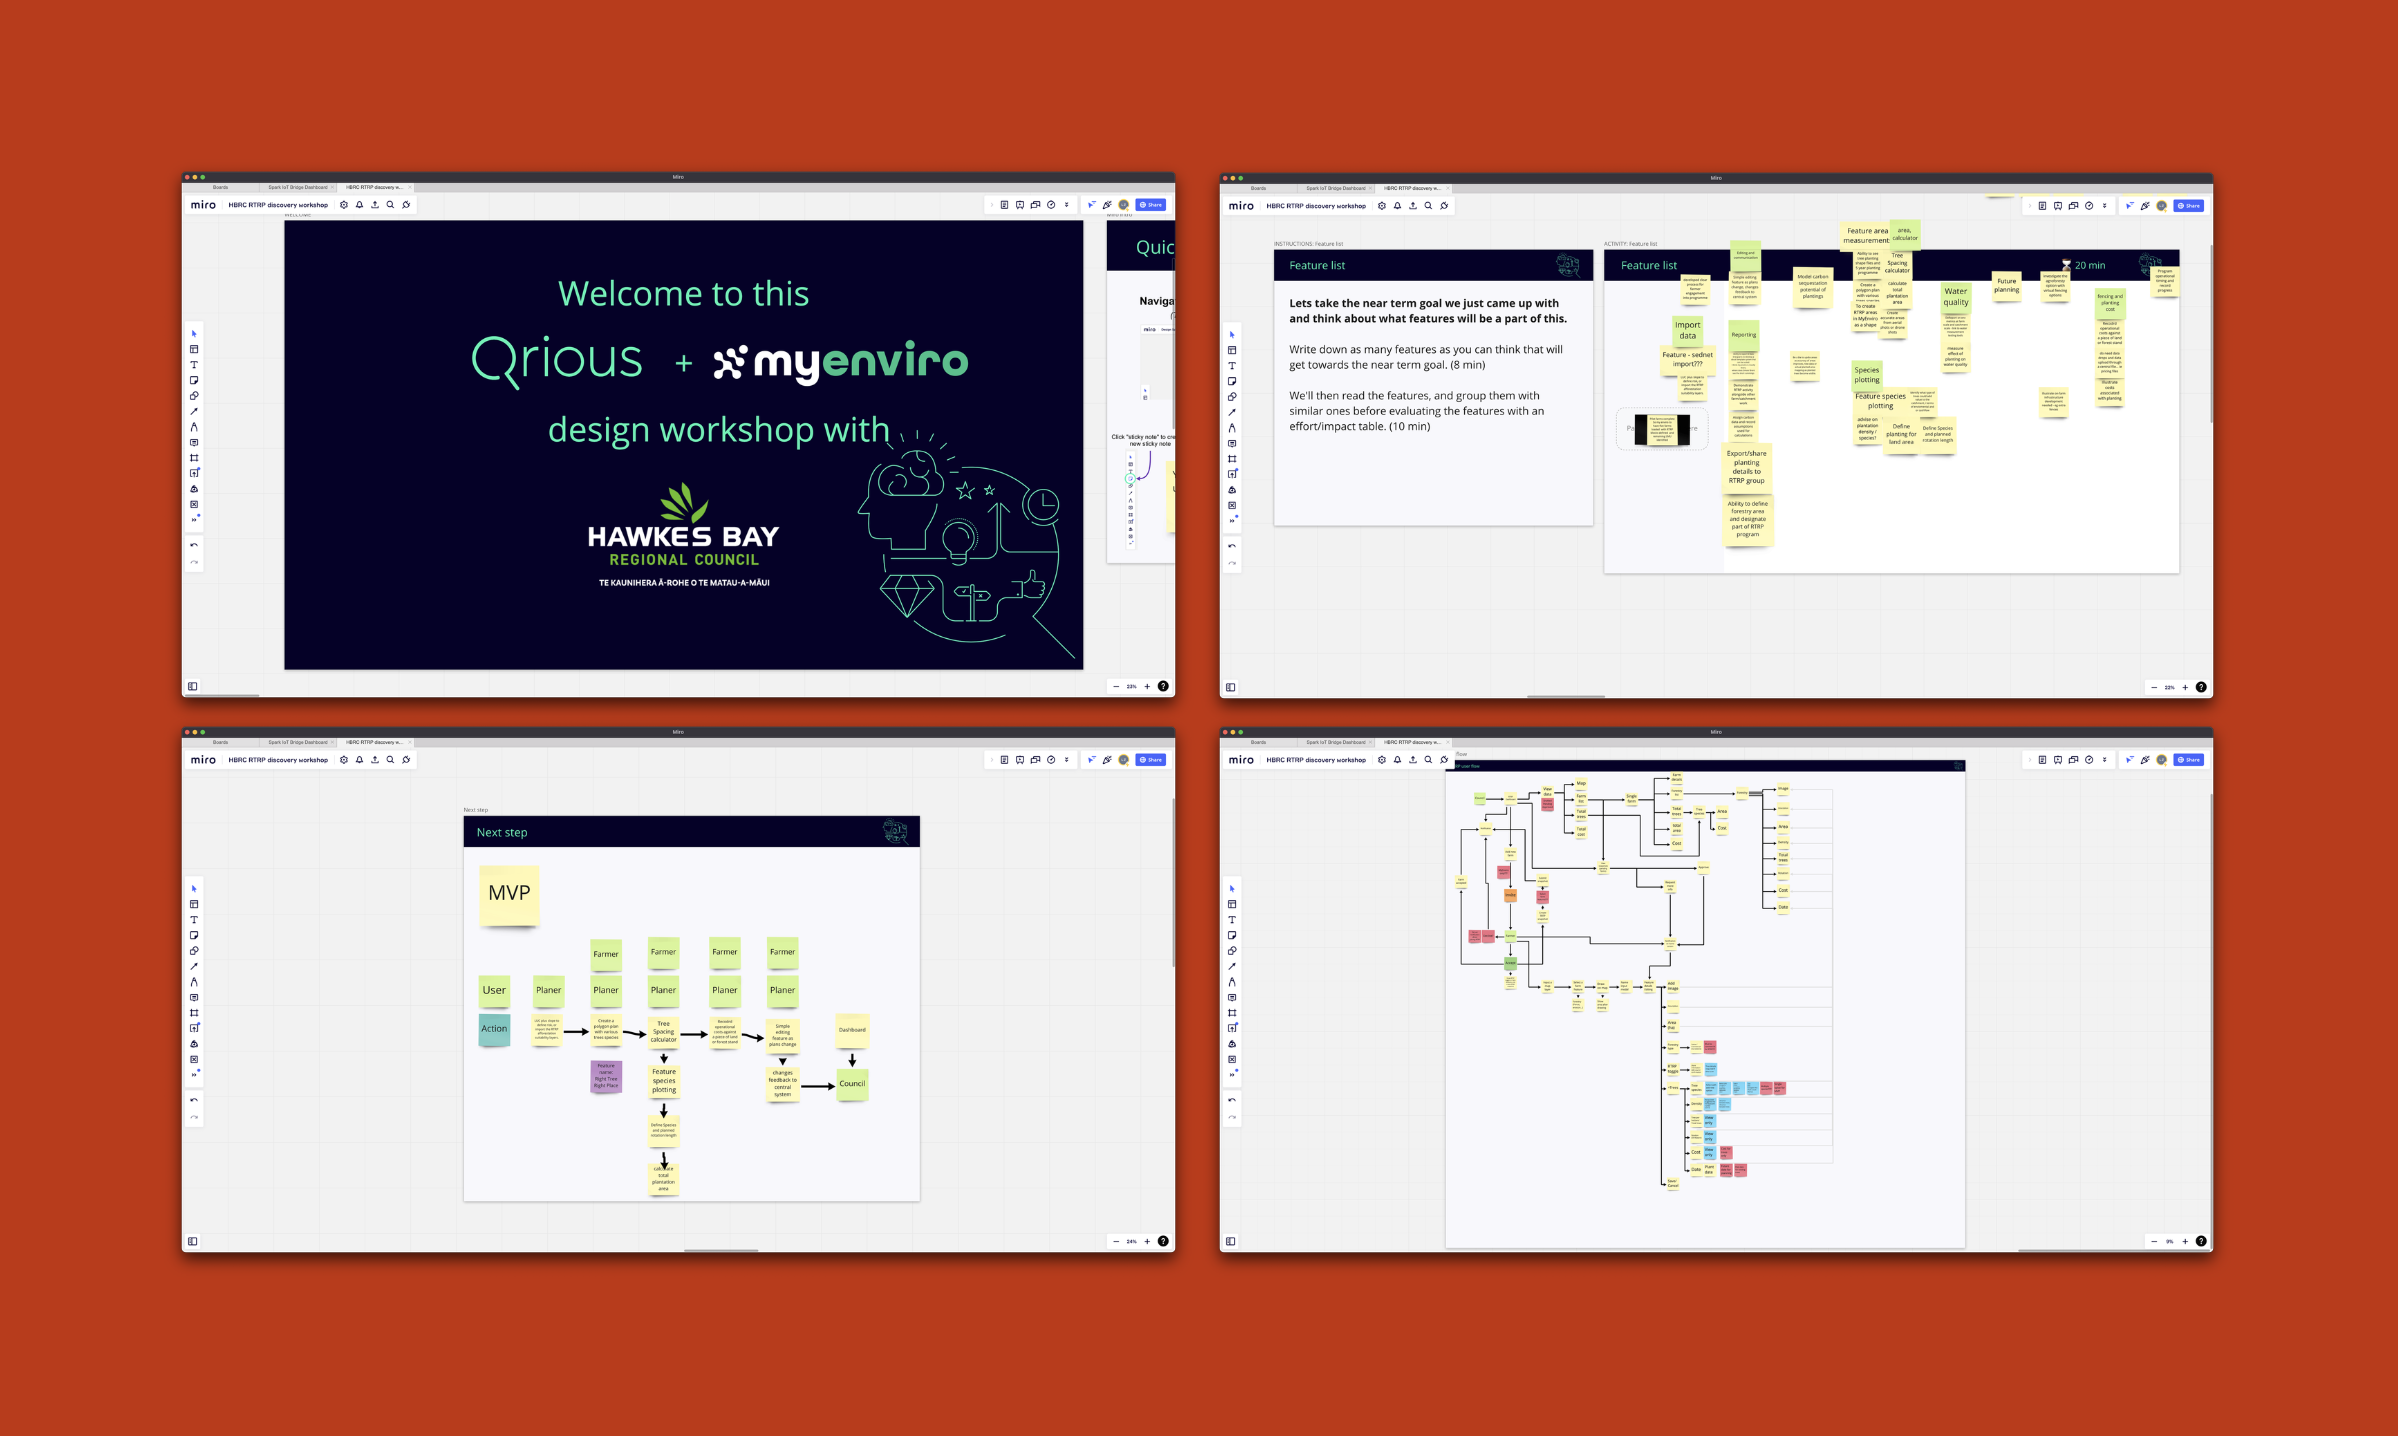
The temptation in a sprint like this is to skip straight to pixels. Two weeks is tight, but it's enough time to do the thinking properly if you structure it right. I ran two intensive workshops with all the key stakeholders in the first few days, getting both the council staff and the farmers in the same room to map requirements and align on what the feature actually needed to do.
Those workshops produced something more valuable than a list of requirements. They revealed the real problem.
Aligning interests
The platform had a data problem. But underneath it was a trust problem.
The original MyEnviro platform was built as a one-way reporting tool: farmers submitted data, the council reviewed it. What I discovered in the workshops was that farmers had no visibility into what the council was seeing or how their submissions were being assessed. They were sending information into a black hole.
That lack of transparency had caused a breakdown in trust on both sides. Farmers felt monitored rather than supported. Council staff were dealing with a constant back-and-forth of clarification emails that slowed every approval down.
The design insight was straightforward: to fix it, both parties needed to see the same data at the same time. Not a reporting tool and a review tool. One shared view. That single decision shaped everything that followed.
Streamlined access
Making the Right Tree Right Place feature work meant making it work for two very different users at once.
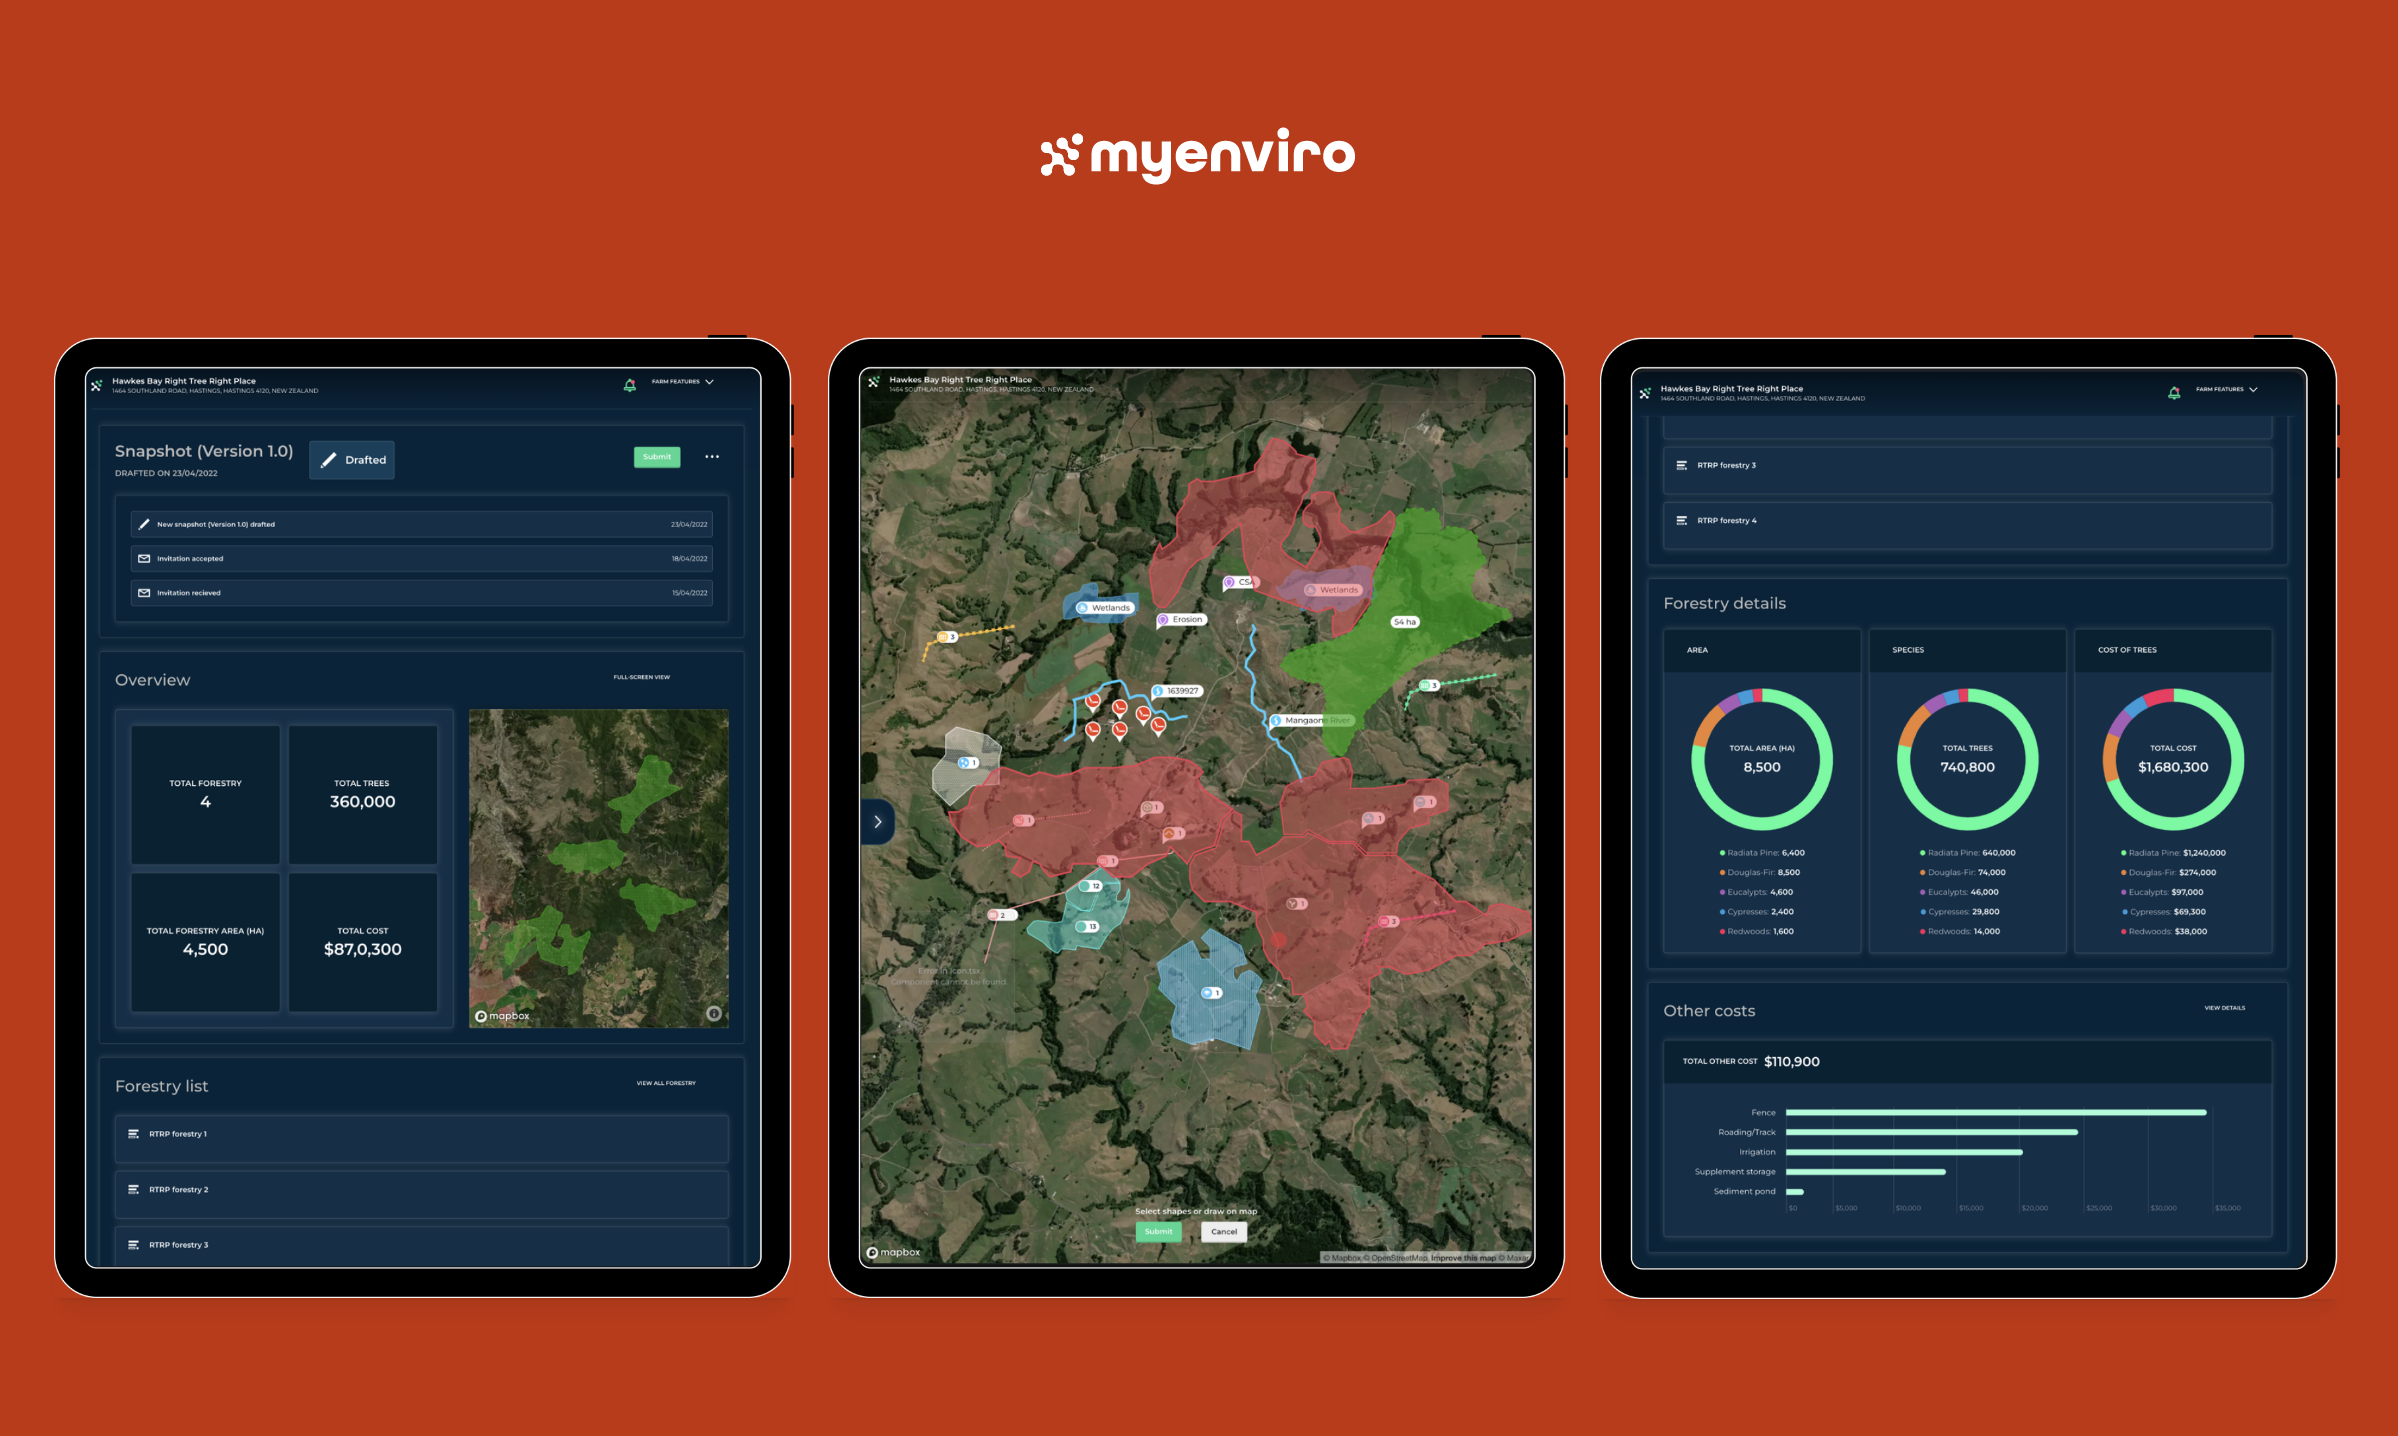
The final design centred on a shared, real-time environment where both council staff and farmers could interact with the same map and the same datasets simultaneously. A complex administrative process became a power tool rather than a paper trail.
Overview dashboard
Gives both parties an immediate summary of where things stand — planting totals, land classes, forestry lists, and status at a glance. No more waiting for a report to understand the current picture.
Map view
Layers environmental data directly onto farm boundaries, so farmers can see exactly where and what to plant, and council staff can review submissions in full geographic context. What once required multiple documents and site visits becomes visible in a single screen.
Forestry data view
Presents detailed analytics in clear charts and status indicators, replacing dense textual reports with something both parties can read and act on without specialist knowledge.
Together, these three screens turned a slow, trust-eroding approval process into something that felt like a shared working environment rather than an audit.
Sharp execution
Full design delivered in two weeks. The approach became the template for what came next.
Sticking to a robust discovery process, even under time pressure, meant the design work that followed was fast and focused. By the time I moved into prototyping, the structural decisions were already made. The engineering team received what they needed on time and without ambiguity.
The shared data view eliminated the back-and-forth between farmers and council staff that had been the biggest source of friction. Approvals moved faster. Communication costs dropped. And both sides of the relationship had something they hadn't had before: a reason to trust the process.
The sprint proved that even complex government workflows can be simplified when you bring the right people into the room early and design around what they actually need from each other.